Bandwidth represents the capacity of the connection. Ancho de banda representa la capacidad de la conexión. The greater the capacity, the more likely that greater performance will follow, though overall performance also depends on other factors, such as latency. Cuanto mayor sea la capacidad, mayor será la probabilidad de que un mayor rendimiento va a seguir, aunque el rendimiento general también depende de otros factores, como la latencia.
Here is the list of bandwidth monitoring tools for your network bandwidth Esta es la lista de herramientas de monitoreo de ancho de banda de tu ancho de banda de red
- bmon bmon
- bwbar bwbar
- bwm BWM
- bwm-ng BWM-ng
- iftop iftop
- iperf iperf
- ipfm ipfm
- speedometer velocímetro
- cbm cbm
- ibmonitor ibmonitor
- pktstat pktstat
- mactrack mactrack
- MRTG MRTG
- Cacti Cactus
Now we will see each tool separately Ahora vamos a ver cada herramienta por separado
bmon bmon
bmon is a portable bandwidth monitor and rate estimator running on various operating systems. bmon es un monitor de ancho de banda portátiles y estimador de tasa que se ejecutan en varios sistemas operativos. It supports various input methods for different architectures. Es compatible con varios métodos de entrada para diferentes arquitecturas.
Various output modes exist including an interactive curses interface, lightweight HTML output but also formatable ASCII output Los diferentes modos de producción existentes figuran una interfaz interactiva maldiciones, ligera salida HTML, pero también de salida ASCII formatable
Current Stable Version :- 2.1.0 Estable, versión actual: - 2.1.0
Install bmon in Ubuntu Instale bmon en Ubuntu
sudo apt-get install bmon sudo apt-get install bmon
This will complete the installation. Esto completará la instalación.
If you want to open the application you need to enter the following command Si desea abrir la aplicación que necesitas para entrar en el siguiente comando
bmon bmon
you should see the following output debería ver la siguiente salida

If i select the eth0 i should see all the traffic details Si selecciono la eth0 tengo de ver todos los detalles del tráfico

If you want to know more available options check man page Si quieres saber más opciones disponibles de verificación página de manual
bwbar bwbar
This program will output a PNG and a text file that can be used in scripts or be included in web pages to show current bandwidth usage. Este programa de salida una PNG y un archivo de texto que se puede utilizar en secuencias de comandos o incluirse en las páginas web para mostrar el uso de ancho de banda actual. The amount of total bandwidth can be customized. La cantidad de ancho de banda total se pueden personalizar. The PNG output appears as a bar graph showing maximum possible usage with the current inbound or outbound usage shown as a differently colored bar. La salida PNG aparece como un gráfico de barras que muestran el uso de lo posible con el uso actual de entrada o salida se muestra como una barra de color diferente.
Current Stable Version :- 1.2.3 Estable, versión actual: - 1.2.3
Install bwbar in ubuntu Instale bwbar en ubuntu
sudo apt-get install bwbar sudo apt-get install bwbar
This will complete the installation Esto completará la instalación
There is a /etc/default/bwbar file to configure before this package will work and here is my config Hay un / etc / default / bwbar archivo para configurar antes de este paquete de trabajo y esta es mi config
# Directory to put files into # Directorio para poner los archivos en
DIR=/var/www DIR = / var / www
# Who to run as # ¿Quién se ejecute como
RUNAS=www-data RUNAS = www-data
# What are the options (eth0, scale of 1.5mbps) # ¿Cuáles son las opciones (eth0, escala de 1,5 Mbps)
OPTIONS=”eth0 1.5″ OPTIONS = "eth0 1,5"
Now you need to chnage the permissions using the following command Ahora tiene que chnage los permisos con el siguiente comando
sudo chown -R www-data:www-data /var/www/bwbar/ www sudo chown-R-data: www-data / var / www / bwbar /
Start the bwbar using the following command Inicie el bwbar con el siguiente comando
sudo /etc/init.d/bwbar start sudo / etc / init.d / bwbar
You can also launch bwbar using the following command También puede iniciar bwbar con el siguiente comando
bwbar eth0 100 -x 200 -y 7 -t 10 -p network.png -f network.txt -d /var/www/bwbar & bwbar eth0 de 100 x 200-y 7-t 10-p-network.png Network.txt f-d / var / www / bwbar &
Now you need to go to http://serverip/bwbar you should see the bandwidth bar as follows Ahora tiene que ir a http://serverip/bwbar usted debe ver la barra de ancho de banda de la siguiente manera

If you want to know about available option check man page Si usted quiere saber acerca de verificación disponibles opción página de manual
bwm BWM
BandWidth Monitor This is a very tiny bandwidth monitor (not X11). Bandwidth Monitor Este es un monitor de ancho de banda muy pequeño (no X11). Can monitor up to 16 interfaces in the in the same time, and shows totals too. Puede controlar hasta 16 interfaces en el en el mismo tiempo, y muestra los totales también.
Current Stable Version :- 1.1.0 Estable, versión actual: - 1.1.0
Install bwm ubuntu Instalar Ubuntu BWM
sudo apt-get install bwm sudo apt-get install BWM
This will complete the installation now Esto completará la instalación ahora
If you want to run the application use the following command Si desea ejecutar la aplicación utilice el siguiente comando
bwm BWM
Output looks like below De salida se parece a continuación

If you want more details and available options check man page Si desea más detalles y opciones disponibles de verificación página de manual
bwm-ng BWM-ng
small and simple console-based bandwidth monitor.Bandwidth Monitor NG is a small and simple console-based live bandwidth monitor. pequeño y simple de ancho de banda basado en consola monitor.Bandwidth GN Monitor es un monitor en vivo pequeño y simple de ancho de banda basado en consola.
Current Stable Version :- 0.5 Estable, versión actual: - 0,5
features características
supports /proc/net/dev, netstat, getifaddr, sysctl, kstat and libstatgrab soportes / proc / net / dev, netstat, getifaddr, sysctl, kstat y libstatgrab
unlimited number of interfaces supported número ilimitado de interfaces compatibles
interfaces are added or removed dynamically from list interfaces se agregan o se quitan de la lista de forma dinámica
white-/blacklist of interfaces white-/blacklist de interfaces
output of KB/s, Kb/s, packets, errors, average, max and total sum salida de KB / s, Kb /, los paquetes, errores, promedio, máximo y suma total
output in curses, plain console, CSV or HTML la producción en maldiciones, simple consola, CSV o HTML
configfile archivo de configuración
Install bwm-ng in ubuntu Instale BWM-ng en ubuntu
sudo apt-get install bwm-ng sudo apt-get install BWM-ng
This will complete the installation Esto completará la instalación
If you want to run the application you need to use the following command Si desea ejecutar la aplicación que necesita usar el siguiente comando
bwm-ng BWM-ng
Output looks like below De salida se parece a continuación

If you want more details and available options check man page Si desea más detalles y opciones disponibles de verificación página de manual
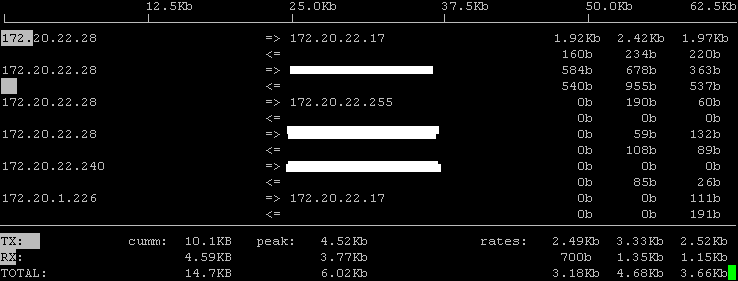
iftop iftop
iftop does for network usage what top does for CPU usage. iftop hace para uso de la red ¿Qué significa para el uso de la CPU. It listens to network traffic on a named interface and displays a table of current bandwidth usage by pairs of hosts. Se escucha el tráfico de red en una interfaz con nombre y muestra una tabla de uso de ancho de banda actual por pares de los ejércitos.
Current Stable Version :- 0.17 Estable, versión actual: - 0,17
Install iftop in ubuntu Instale iftop en ubuntu
sudo apt-get install iftop sudo apt-get install iftop
This will complete the installation Esto completará la instalación
If you want to run the application you need to use the following command Si desea ejecutar la aplicación que necesita usar el siguiente comando
iftop iftop
Output looks like below De salida se parece a continuación
If you want more details and available options check man page Si desea más detalles y opciones disponibles de verificación página de manual
ipfm ipfm
IP Flow Meter (IPFM) is a bandwidth analysis tool, that measures how much bandwidth specified hosts use on their Internet link. Medidor de flujo IP (IPFM) es una herramienta de análisis de ancho de banda, que mide la cantidad de ancho de banda hosts especificados uso en su enlace a Internet.
Current Stable Version :- 0.11.5 Estable, versión actual: - 0.11.5
Install ipfm in Ubuntu Instale ipfm en Ubuntu
sudo apt-get install ipfm sudo apt-get install ipfm
This will complete the installation Esto completará la instalación
Now if you want to configure this for your network you need to copy example configuration file from /usr/share/doc/ipfm/examples if you want to check this file click here Ahora bien, si desea configurar este para la red tiene que copiar el archivo de configuración de ejemplo de / usr / share / doc / ipfm / ejemplos si es que desea comprobar este archivo, haga clic aquí
once you configure this file you need to start the service using the following command una vez que configurar este archivo usted necesita para iniciar el servicio con el siguiente comando
sudo /etc/init.d/ipfm start sudo / etc / init.d / ipfm
If you want more details and available options check man page Si desea más detalles y opciones disponibles de verificación página de manual
Speedometer Velocímetro
Measure and display the rate of data across a network connection or data being stored in a file. Medir y mostrar el tipo de datos a través de una conexión de red o datos que se almacena en un archivo.
Current Stable Version :- 2.4 Estable, versión actual: - 2,4
Install speedometer in ubuntu Instalar Ubuntu en el indicador de velocidad
Check which version of python is the default by running Compruebe la versión de Python es el valor por defecto mediante la ejecución de
python -V python-V
Then issue the following commands as root to install speedometer (choose the correct Urwid package for your python version, ie. if python -V reports version 2.3.X then install python2.3-urwid) A continuación, ejecute los siguientes comandos como root para instalar el velocímetro (elegir el paquete correcto para su versión Urwid python, es decir. Si python-V versión 2.3.x informes a continuación, instalar python2.3-urwid)
apt-get install python2.4-urwid apt-get install python2.4-urwid
Download the speedometer.py source file. Descargue el speedometer.py archivo de origen.
As user issue the following commands in the directory that you downloaded the source file Como cuestión de usuario los siguientes comandos en el directorio que ha descargado el archivo de origen
sudo cp speedometer.py /usr/local/bin/speedometer speedometer.py sudo cp / usr / local / bin / indicador de velocidad
sudo chown root: /usr/local/bin/speedometer chown root sudo: / usr / local / bin / indicador de velocidad
sudo chmod 755 /usr/local/bin/speedometer sudo chmod 755 / usr / local / bin / indicador de velocidad
Now you can run the speedometer application using the following Ahora se puede ejecutar la aplicación usando el siguiente indicador de velocidad
/usr/local/bin/speedometer / Usr / local / bin / indicador de velocidad
Now you should see the following screen output Ahora debería poder ver la salida siguiente pantalla

Speedometer Usage Velocímetro de uso
Usage: speedometer [options] tap [[-c] tap] Uso: velocímetro opciones [] toque [[-c]] del grifo
Available options Las opciones disponibles
speedometer -h velocímetro-h
Usage: speedometer [options] tap [[-c] tap]… Uso: velocímetro opciones [] toque [[-c] del grifo] ...
Monitor network traffic or speed/progress of a file transfer. Monitor de tráfico de la red o la velocidad / el progreso de una transferencia de archivos. At least one tap must be entered. Al menos un grifo debe ser ingresado. -c starts a new column, otherwise taps are piled vertically. -C se inicia una nueva columna, de lo contrario los grifos son apilados verticalmente.
Taps: Grifos:
[-f] filename [size] display download speed [with progress bar] [-F] archivo [] tamaño de la pantalla de descarga velocidad [con] la barra de progreso
-f must be used if directly following another -F debe utilizarse si inmediatamente después de otro
file tap without an expected size specified archivo del grifo, sin un tamaño previsto que se especifica
-rx network-interface display bytes received on network-interface Rx-pantalla con interfaz de red bytes recibidos en la red de la interfaz
-tx network-interface display bytes transmitted on network-interface -Tx pantalla con interfaz de red bytes transmitidos en la red de la interfaz
Options: Opciones:
-i interval-in-seconds eg. Intervalo i-en-segundo por ejemplo. “5″ or “0.25″ default: “1″ "5" o "0,25" por defecto: "1"
-p use plain-text display (one tap only) -P utilizar su pantalla de texto sin formato (un toque solamente)
-b use old blocky display instead of smoothed display even when UTF-8 encoding is detected utilizar-b antiguo bloque pantalla en lugar de mostrar suavizado aún cuando codificación UTF-8 se detecta
-z report zero size on files that don't exist instead of waiting for them to be created -Z informe de tamaño cero en archivos que no existen en vez de esperar que sean creados
Usage Examples Ejemplos de uso
How long it will take for my 38MB transfer to finish? ¿Cuánto tiempo tomará para que mi traslado 38MB para terminar?
speedometer favorite_episode.rm $((38*1024*1024)) favorite_episode.rm velocímetro $ ((38 * 1024 * 1024))
How quickly is another transfer going? La rapidez es otra transferencia a ir?
speedometer dl/big.avi dl velocímetro / big.avi
How fast is this LAN? ¿Qué velocidad tiene esta LAN?
$ cat /dev/zero | nc -l -p 12345 $ cat / dev / zero | nc-l-p 12345
$ nc host-a 12345 > /dev/null $ host nc-a> 12345 / dev / null
$ speedometer -rx eth0 $ Velocímetro-eth0 rx
How fast is the upstream on this ADSL line? ¿Qué tan rápido es la corriente en esta línea de ADSL?
speedometer -tx ppp0 velocímetro-tx ppp0
How fast can I write data to my filesystem? ¿Qué tan rápido puedo escribir datos en mi sistema de ficheros? (with at least 1GB free) (Con al menos 1 GB libre)
dd bs=1000000 count=1000 if=/dev/zero of=big_nothing & dd bs = 1000000 count = 1000 if = / dev / zero of = & big_nothing
speedometer big_nothing velocímetro big_nothing
cbm cbm
cbm — the Color Bandwidth Meter — displays the current traffic on all network devices. cbm - el color de Bandwidth Meter - muestra el tráfico actual en todos los dispositivos de red.
Current Stable Version :- 0.1-1 Estable, versión actual: - 0.1-1
Install cbm in ubuntu Instalar Ubuntu en el cbm
First you need to download the .deb package from here Primero tendrá que descargar el paquete deb. Desde aquí
once you have the .deb package you need to install using the following comamnd una vez que usted tiene el paquete deb. necesita instalar usando el siguiente comamnd
sudo dpkg -i cbm_0.1-1_i386.deb sudo dpkg-i cbm_0.1-1_i386.deb
this will complete the installation now if you want to use the appltcation use the following command Esto completará la instalación ahora si usted desea utilizar el appltcation utilice el siguiente comando
cbm cbm
Output looks like below De salida se parece a continuación

pktstat pktstat
pktstat listens to the network and shows the bandwidth being consumed by packets of various kinds in realtime. pktstat escucha a la red y muestra el ancho de banda consumido por los paquetes de varios tipos en tiempo real. It understands some protocols (including FTP,HTTP, and X11) and adds a descriptive name next to the entry (eg, 'RETR cd8.iso', 'GET http://slashdot.org/' or 'xclock -fg blue'). Entiende algunos protocolos (como FTP, HTTP, y X11) y añade un nombre descriptivo al lado de la entrada (por ejemplo, "RETR cd8.iso ',' GET http://slashdot.org/ 'o' xclock-fg azul ' ).
Current Stable Version :- 1.8.3 Estable, versión actual: - 1.8.3
Install pktstat in Ubuntu Instale pktstat en Ubuntu
First you need to download .rpm package from here once you have the .rpm package you need to convert this .rpm file to .deb file using alien Lo primero que necesita para descargar. Paquete rpm de aquí una vez que tener el paquete rpm. tendrás que convertir esto. rpm archivo. deb usando exóticas
Install alien Instale exóticas
sudo apt-get install alien sudo apt-get install exóticas
Now you need to use the follwoing command to convert .rpm to .deb Ahora tiene que utilizar el comando follwoing convertir. Rpm a. Deb
sudo alien -k pktstat-1.7.2q-0.i386.rpm pktstat sudo alien-k-1.7.2q-0.i386.rpm
Now you should be having pktstat_1.7.2q-0_i386.deb package Ahora usted debe tener el paquete pktstat_1.7.2q-0_i386.deb
Install pktstat in Ubuntu Instale pktstat en Ubuntu
sudo dpkg -i pktstat_1.7.2q-0_i386.deb sudo dpkg-i-0_i386.deb pktstat_1.7.2q
This will complete the installation now you can open the application using the following command Esto completará la instalación ahora puede abrir la aplicación que utiliza el siguiente comando
pktstat pktstat
output looks like below de salida se parece a continuación

If you want more available options for pktstat check man page Si desea más opciones disponibles para comprobar la pktstat página de manual
ibmonitor ibmonitor
ibmonitor is an interactive linux console application which shows bandwidth consumed and total data transferred on all interfaces. ibmonitor es una aplicación de consola linux interactiva que muestra los datos de ancho de banda consumido y total transferido en todas las interfaces.
Current Stable Version :- 1.4 Estable, versión actual: - 1,4
Its main features are: Sus principales características son:
Shows received, transmitted and total bandwidth of each interface Muestra recibida, transmitida y ancho de banda total de cada interfaz
Calculates and displays the combined value of all interfaces Calcula y muestra el valor combinado de todas las interfaces
Displays total data transferred per interface in KB/MB/GB Muestra el total de datos transferidos por interfaz en KB / MB / GB
Values can be displayed in Kbits/sec(Kbps) and/or KBytes/sec(KBps) Los valores se pueden visualizar en Kbits / seg (Kbps) y / o KBytes / seg (Kbps)
Can show maximum bandwidth consumed on each interface since start of utility Puede mostrar ancho de banda máximo consumido en cada interfaz desde el comienzo de la utilidad
Can show average bandwidth consumption on each interface since start of utility Puede mostrar el consumo promedio de ancho de banda en cada interfaz desde el comienzo de la utilidad
The output with all features (max, avg and display in Kbps and KBps) easily fits on a 80×24 console or xterm La salida con todas las características (máximo, media y mostrar en Kbps y KB / seg) cabe fácilmente en un 80 × 24 consola o xterm
Can interactively change its output display format depending on key pressed by user. interactivamente puede cambiar su formato de visualización de salida en función de tecla pulsada por el usuario.
Install ibmonitor in Ubuntu Instale ibmonitor en Ubuntu
First you need to download the latest version from here En primer lugar es necesario descargar la última versión desde aquí
wget http://ovh.dl.sourceforge.net/sourceforge/ibmonitor/ibmonitor-1.4.tar.gz wget http://ovh.dl.sourceforge.net/sourceforge/ibmonitor/ibmonitor-1.4.tar.gz
Now you have ibmonitor-1.4.tar.gz Ahora usted tiene ibmonitor-1.4.tar.gz
Extract this file using the following commands Extracto de este archivo usando los siguientes comandos
tar xvfz ibmonitor-1.4.tar.gz tar xvfz ibmonitor-1.4.tar.gz
cd ibmonitor ibmonitor cd
If you want to run the application use the following command Si desea ejecutar la aplicación utilice el siguiente comando
Once you are in ibmonitor folder use Una vez que esté en uso ibmonitor carpeta
./ibmonitor . / Ibmonitor
Output looks like the following screen De salida se parece a la siguiente pantalla

iperf iperf
While tools to measure network performance, such as ttcp, exist, most are very old and have confusing options. Mientras que las herramientas para medir el rendimiento de la red, como ttcp, existen, la mayoría son muy antiguos y contienen opciones confusas. Iperf was developed as a modern alternative for measuring TCP and UDP bandwidth performance. Iperf fue desarrollado como una alternativa moderna para medir el rendimiento de TCP y UDP ancho de banda.
Iperf is a tool to measure maximum TCP bandwidth, allowing the tuning of various parameters and UDP characteristics. Iperf es una herramienta para medir el ancho de banda máximo TCP, permitiendo el ajuste de varios parámetros y las características de UDP. Iperf reports bandwidth, delay jitter, datagram loss. Iperf informes jitter ancho de banda, retraso, pérdida de datagramas.
Current Stable Version :- 2.0.2 Estable, versión actual: - 2.0.2
Install iperf in ubuntu Instale iperf en ubuntu
sudo apt-get install iperf sudo apt-get install iperf
iperf Syntax iperf Sintaxis
iperf [-s|-c host] [options] iperf [-s |-c de acogida] [opciones]
Example Ejemplo
iperf -c server address -F file-name iperf-c-F dirección del servidor de nombre de archivo
iperf -c server address -I iperf-c dirección del servidor-I
The -F option is for file input. La opción-F-es para la entrada del archivo.
The -I option is for input from stdin. La opción-I es para la entrada de stdin.
If you want more details and available options check man page Si desea más detalles y opciones disponibles de verificación página de manual
tcptrack tcptrack
tcptrack is a sniffer which displays information about TCP connections it sees on a network interface. tcptrack es un sniffer que muestra información acerca de las conexiones TCP, se ve en una interfaz de red. It passively watches for connections on the network interface, keeps track of their state and displays a list of connections in a manner similar to the unix 'top' command. Se observa pasivamente las conexiones en la interfaz de red, comprueba su estado y muestra una lista de conexiones de una manera similar a la de Unix 'top' de comandos. It displays source and destination addresses and ports, connection state, idle time, and bandwidth usage. Muestra direcciones de origen y destino y puertos, el estado de conexión, tiempo de inactividad, y el uso de ancho de banda.
Current Stable Version :- 1.1.5 Estable, versión actual: - 1.1.5
Install tcptrack in Ubuntu Instale tcptrack en Ubuntu
sudo apt-get install tcptrack sudo apt-get install tcptrack
this will complete the installation Esto completará la instalación
tcptrack Syntax tcptrack Sintaxis
tcptrack [-dfhvp] [-r ] -i [] tcptrack [dfhvp] [-r]-i []
Examples Ejemplos
tcptrack requires only one parameter to run: the -i flag followed by an interface name that you want tcptrack to monitor. tcptrack requiere sólo un parámetro para ejecutar: la bandera-i seguido de un nombre de interfaz que desea tcptrack de controlar. This is the most basic way to run tcptrack Esta es la forma más básica para ejecutar tcptrack
tcptrack -i eth0 tcptrack-i eth0
tcptrack can also take a pcap filter expression as an argument. tcptrack También puede tomar una expresión de filtro pcap como argumento. The format of this filter expression is the same as that of tcpdump and other El formato de esta expresión de filtro es la misma que la de tcpdump y otras
libpcap-based sniffers. sniffers basada libpcap. The following example will only show connections from host 10.45.165.2 En el ejemplo siguiente sólo se muestran las conexiones de host 10.45.165.2
tcptrack -i eth0 src or dst 10.45.165.2 tcptrack-i eth0 src o dst 10.45.165.2
The next example will only show web traffic (ie, traffic on port 80) En el siguiente ejemplo sólo se mostrará el tráfico web (es decir, el tráfico en el puerto 80)
tcptrack -i eth0 port 80 tcptrack-i eth0 puerto 80
The following output screen will show you more details La pantalla siguiente salida le mostrará más detalles

MRTG MRTG
The Multi Router Traffic Grapher or just simply MRTG is free software for monitoring the traffic load on network links. El Multi Router Traffic Grapher MRTG o simplemente es software libre para supervisar la carga de tráfico en los enlaces de red. It allows the user to see traffic load on a network over time in graphical form. Permite al usuario ver la carga de tráfico en una red a través del tiempo en forma gráfica.
Current Stable Version :- 2.15.0 Estable, versión actual: - 2.15.0
Project Homepage Página web del proyecto
http://oss.oetiker.ch/mrtg/ http://oss.oetiker.ch/mrtg/
Cacti Cactus
Cacti is a complete network graphing solution designed to harness the power of RRDTool's data storage and graphing functionality. Cacti es una solución de red gráficas completas diseñadas para aprovechar el poder de almacenamiento de datos y la funcionalidad de RRDtool gráfica. Cacti provides a fast poller, advanced graph templating, multiple data acquisition methods, and user management features out of the box. Cactus ofrece una rápida Poller, gráfica avanzada de plantillas, múltiples métodos de adquisición de datos, gestión de usuarios y características de la caja. All of this is wrapped in an intuitive,easy to use interface that makes sense for LAN-sized installations up to complex networks with hundreds of devices. Todo esto está envuelto en una interfaz intuitiva y fácil de usar interfaz que tenga sentido para instalaciones de LAN de tamaño hasta redes complejas con cientos de dispositivos.
No hay comentarios:
Publicar un comentario